F1 Race Result Prediction
Learning machine learning through a sport I follow. Historical Formula 1 results turned into a ranking model, served as an app that predicts a finishing order from a grid you type in.
What it is A ranking model that predicts the finishing order of a Formula 1 race from the starting grid, wrapped in an interactive application.
What I built The data pipeline, the temporal feature engineering, the LightGBM ranking model, and the Streamlit app that runs it.
My role
I started this to teach myself machine learning on a subject I already followed closely, and worked through it from the raw historical tables to the running application: preparing and joining the data, the scraper that assembles the current season, the rolling form features and the shift that keeps a race out of its own features, the decision to train a ranking objective instead of a regressor, and the Streamlit interface with its grid entry, paste parsing and validation.
01
A subject I already cared about
The fastest way to learn a method is to point it at something you already argue about.
I follow Formula 1, and cars and the automotive side of engineering are what got me into this field in the first place. When I wanted to actually learn machine learning instead of reading about it, that seemed like the obvious place to start. I already knew what a good answer looked like, and I would notice straight away if a model told me something absurd.
That turned out to matter more than I expected. Knowing the sport is what caught the mistakes. If the model puts a driver in a midfield car on pole, I do not have to go and measure anything. I can see it is wrong and go and find out why.
The question I set the project was a narrow one, because a narrow question is answerable: given a starting grid for a particular Grand Prix, what finishing order should we expect?
02
Seventy-five years of results, shaped into a training set
Formula 1 history is well recorded. It is not well shaped for a model.
The historical data is the standard relational set: races, circuits, drivers, constructors, results, qualifying and status, going back to 1950. Getting from there to a training table is most of the work.
Results and races join on the race, qualifying collapses to each driver’s best position across Q1 to Q3, and the whole thing is sorted into the order the seasons actually happened so that anything computed over time is computed in the right direction.
The current season is not in the historical dataset, so I wrote a scraper for it. It reads the race classification tables from the Wikipedia pages of the 2025 Grands Prix run so far, normalises driver names and the many spellings of each team into stable slugs, and writes out the same shape as the historical files.
Training starts in 2021, not 1950. The sport’s regulations, car concepts and points systems have changed so much that a result from an earlier era is describing a different sport. The window is derived from the data instead of being hardcoded. The model trains up to the last complete season and predicts the one after it, so the app reports “training 2021 to 2024, predicting 2025” because that is what the files contain.
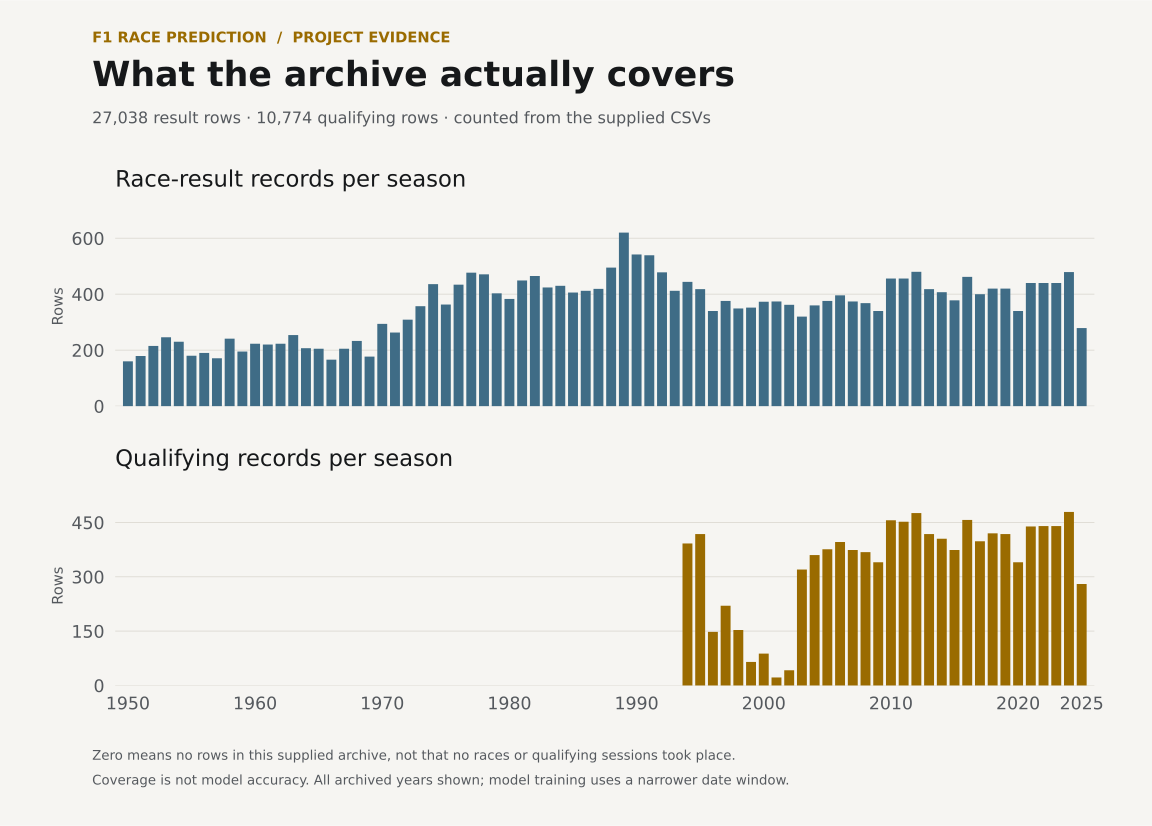
- Historical results 27,038 race results, 1950 to 2025
- Qualifying 10,774 sessions, reduced to one best position per driver per race
- Training window 2021 to the last complete season
- Current season Scraped from per-race Wikipedia classification tables
- Objective Learning to rank: LightGBM lambdarank, ndcg, grouped by race
03
Only what was knowable before the lights went out
The interesting part of a sports model is not the algorithm. It is making sure the features could not have known the answer.
A driver’s recent form is the single most useful signal available, and it is also the easiest way to build a model that looks excellent and is worthless. If the rolling average of a driver’s finishing position includes this race, then the feature contains the label, and the model will learn to read the answer off it.
The four form features are built so that cannot happen. Each one is a rolling mean of the last three finishing positions, and each is shifted by one race first, so the value attached to a race is computed strictly from the races before it:
app.py · build_training_table()
df["drv_last3_mean"] = (
  df.groupby("driverId")["positionOrder"]
      # shift(1) first: this race cannot see its own result
    .transform(lambda s: s.shift(1).rolling(3, min_periods=1).mean())
)
The shift comes before the rolling window, so a race never contributes to its own feature.
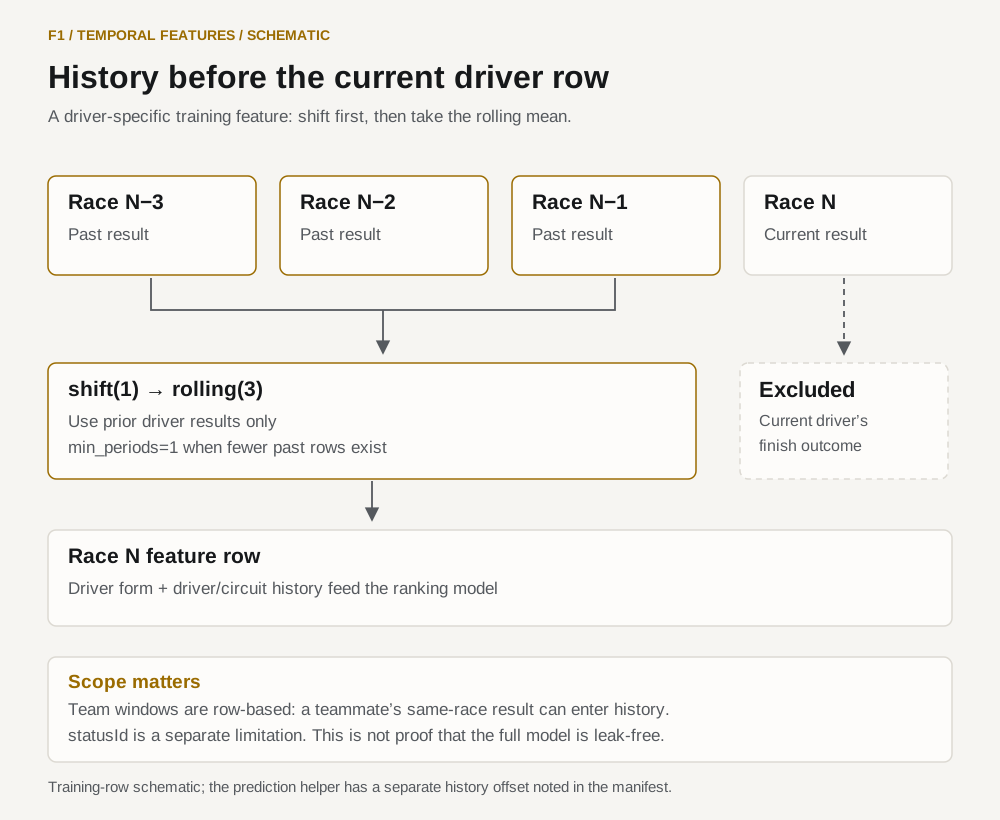
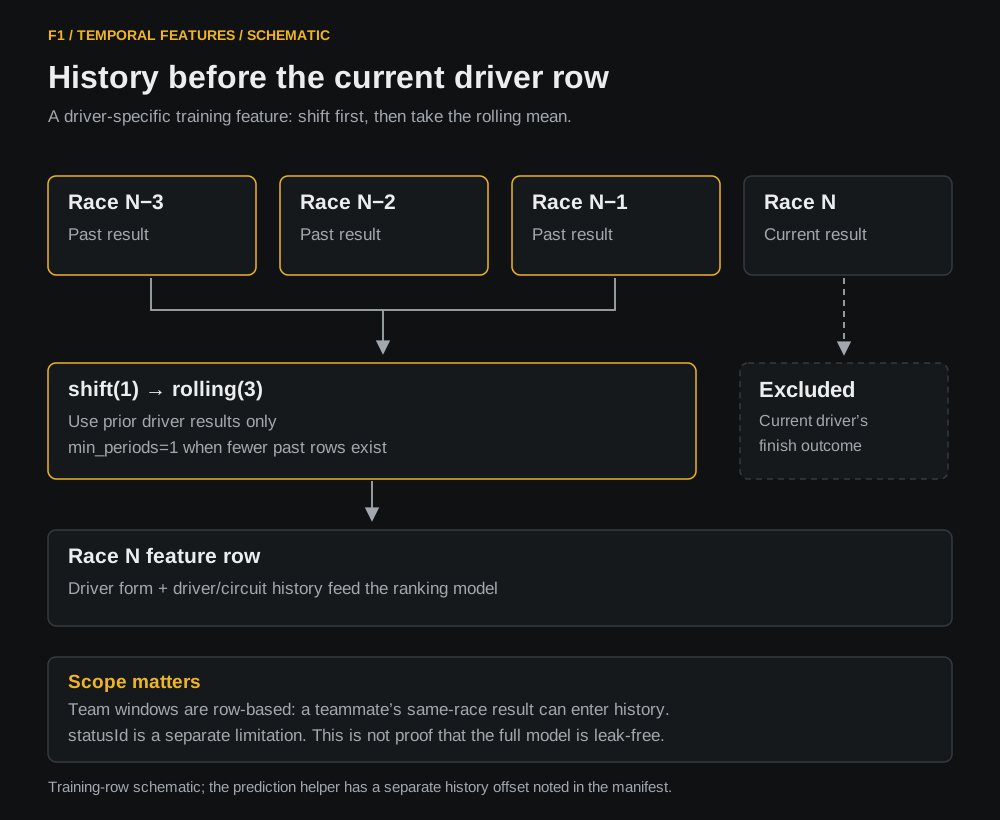
The same construction gives four views of form at different resolutions: the driver overall, the driver at this particular circuit, the team overall, and the team at this circuit. Monaco and Monza reward such different cars that a team’s general form and its form at a given track are genuinely different numbers.
The second decision is the objective. Predicting a finishing position as a plain
number treats the gap between first and second as identical to the gap between
fifteenth and sixteenth, and it has no idea that exactly one car can finish
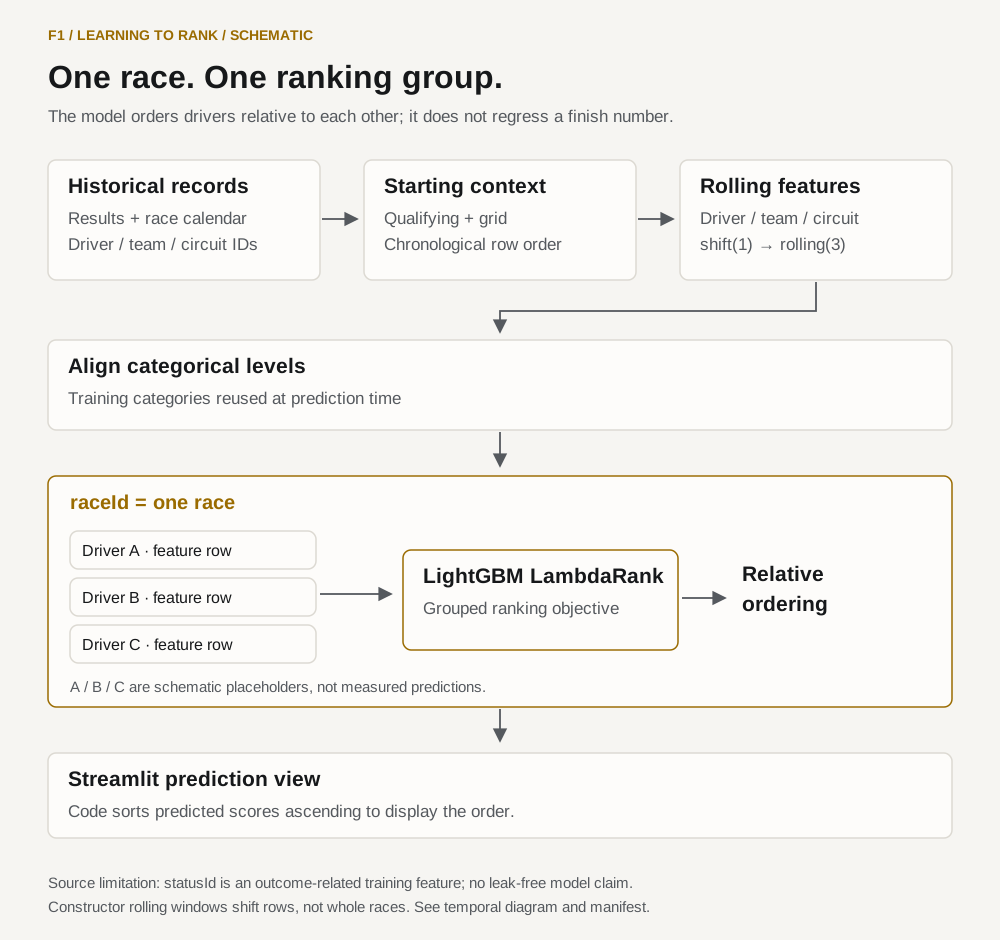
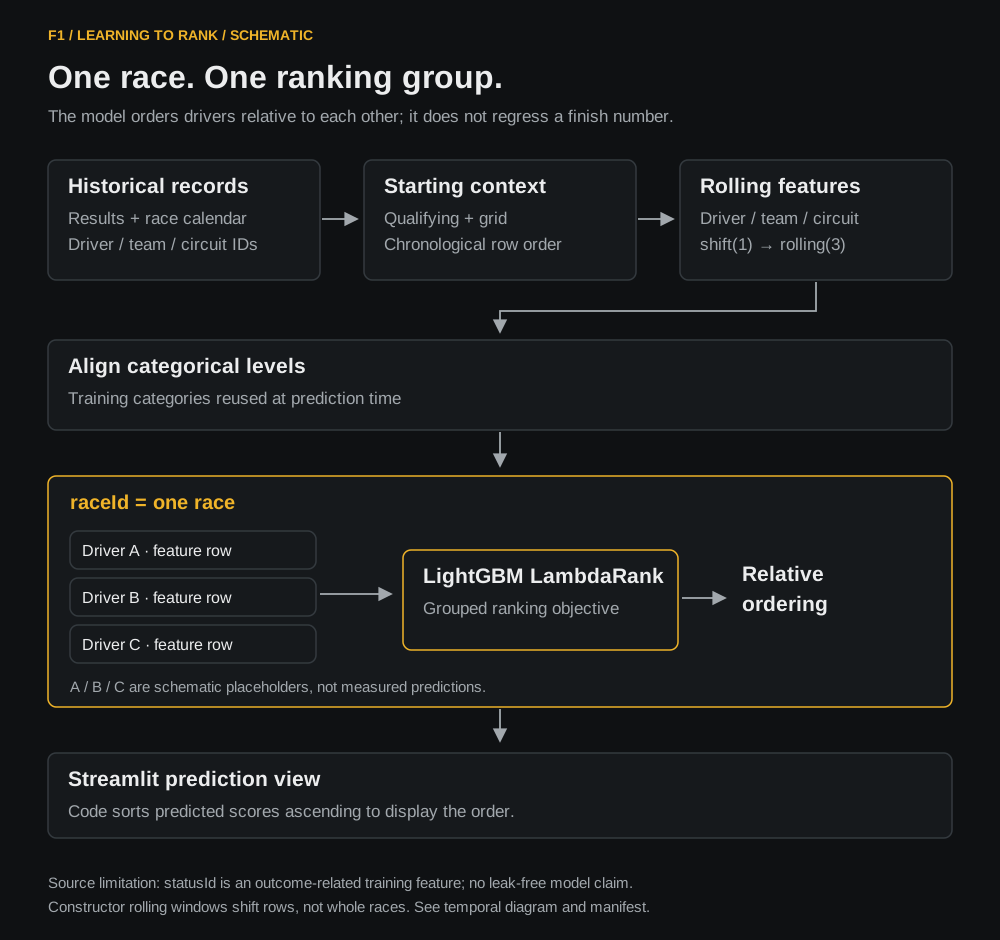
first. So the model is trained to rank instead: LightGBM’s lambdarank
objective, with the rows grouped by race, so each race is one ranking problem
and the model is scored on the order it produces within that race instead of on
absolute error per driver.
In my own evaluation of the project the model reached roughly 82% accuracy. That is the figure I recorded from my work at the time, and it is worth reading as what it is: a project result, not a benchmark I have since reproduced under a documented protocol. The metric definition and validation scheme are not written down anywhere in the material I kept. A number is only as useful as the record of how it was produced.
04
From a trained model to something you can actually use
A model in a notebook answers questions you have already asked. An application answers the ones you have not.
The last step was turning the trained model into something with a grid in it. The app loads the CSVs, builds the training table, trains the ranker once and caches it, then offers a Grand Prix, a driver count and twenty positions to fill.
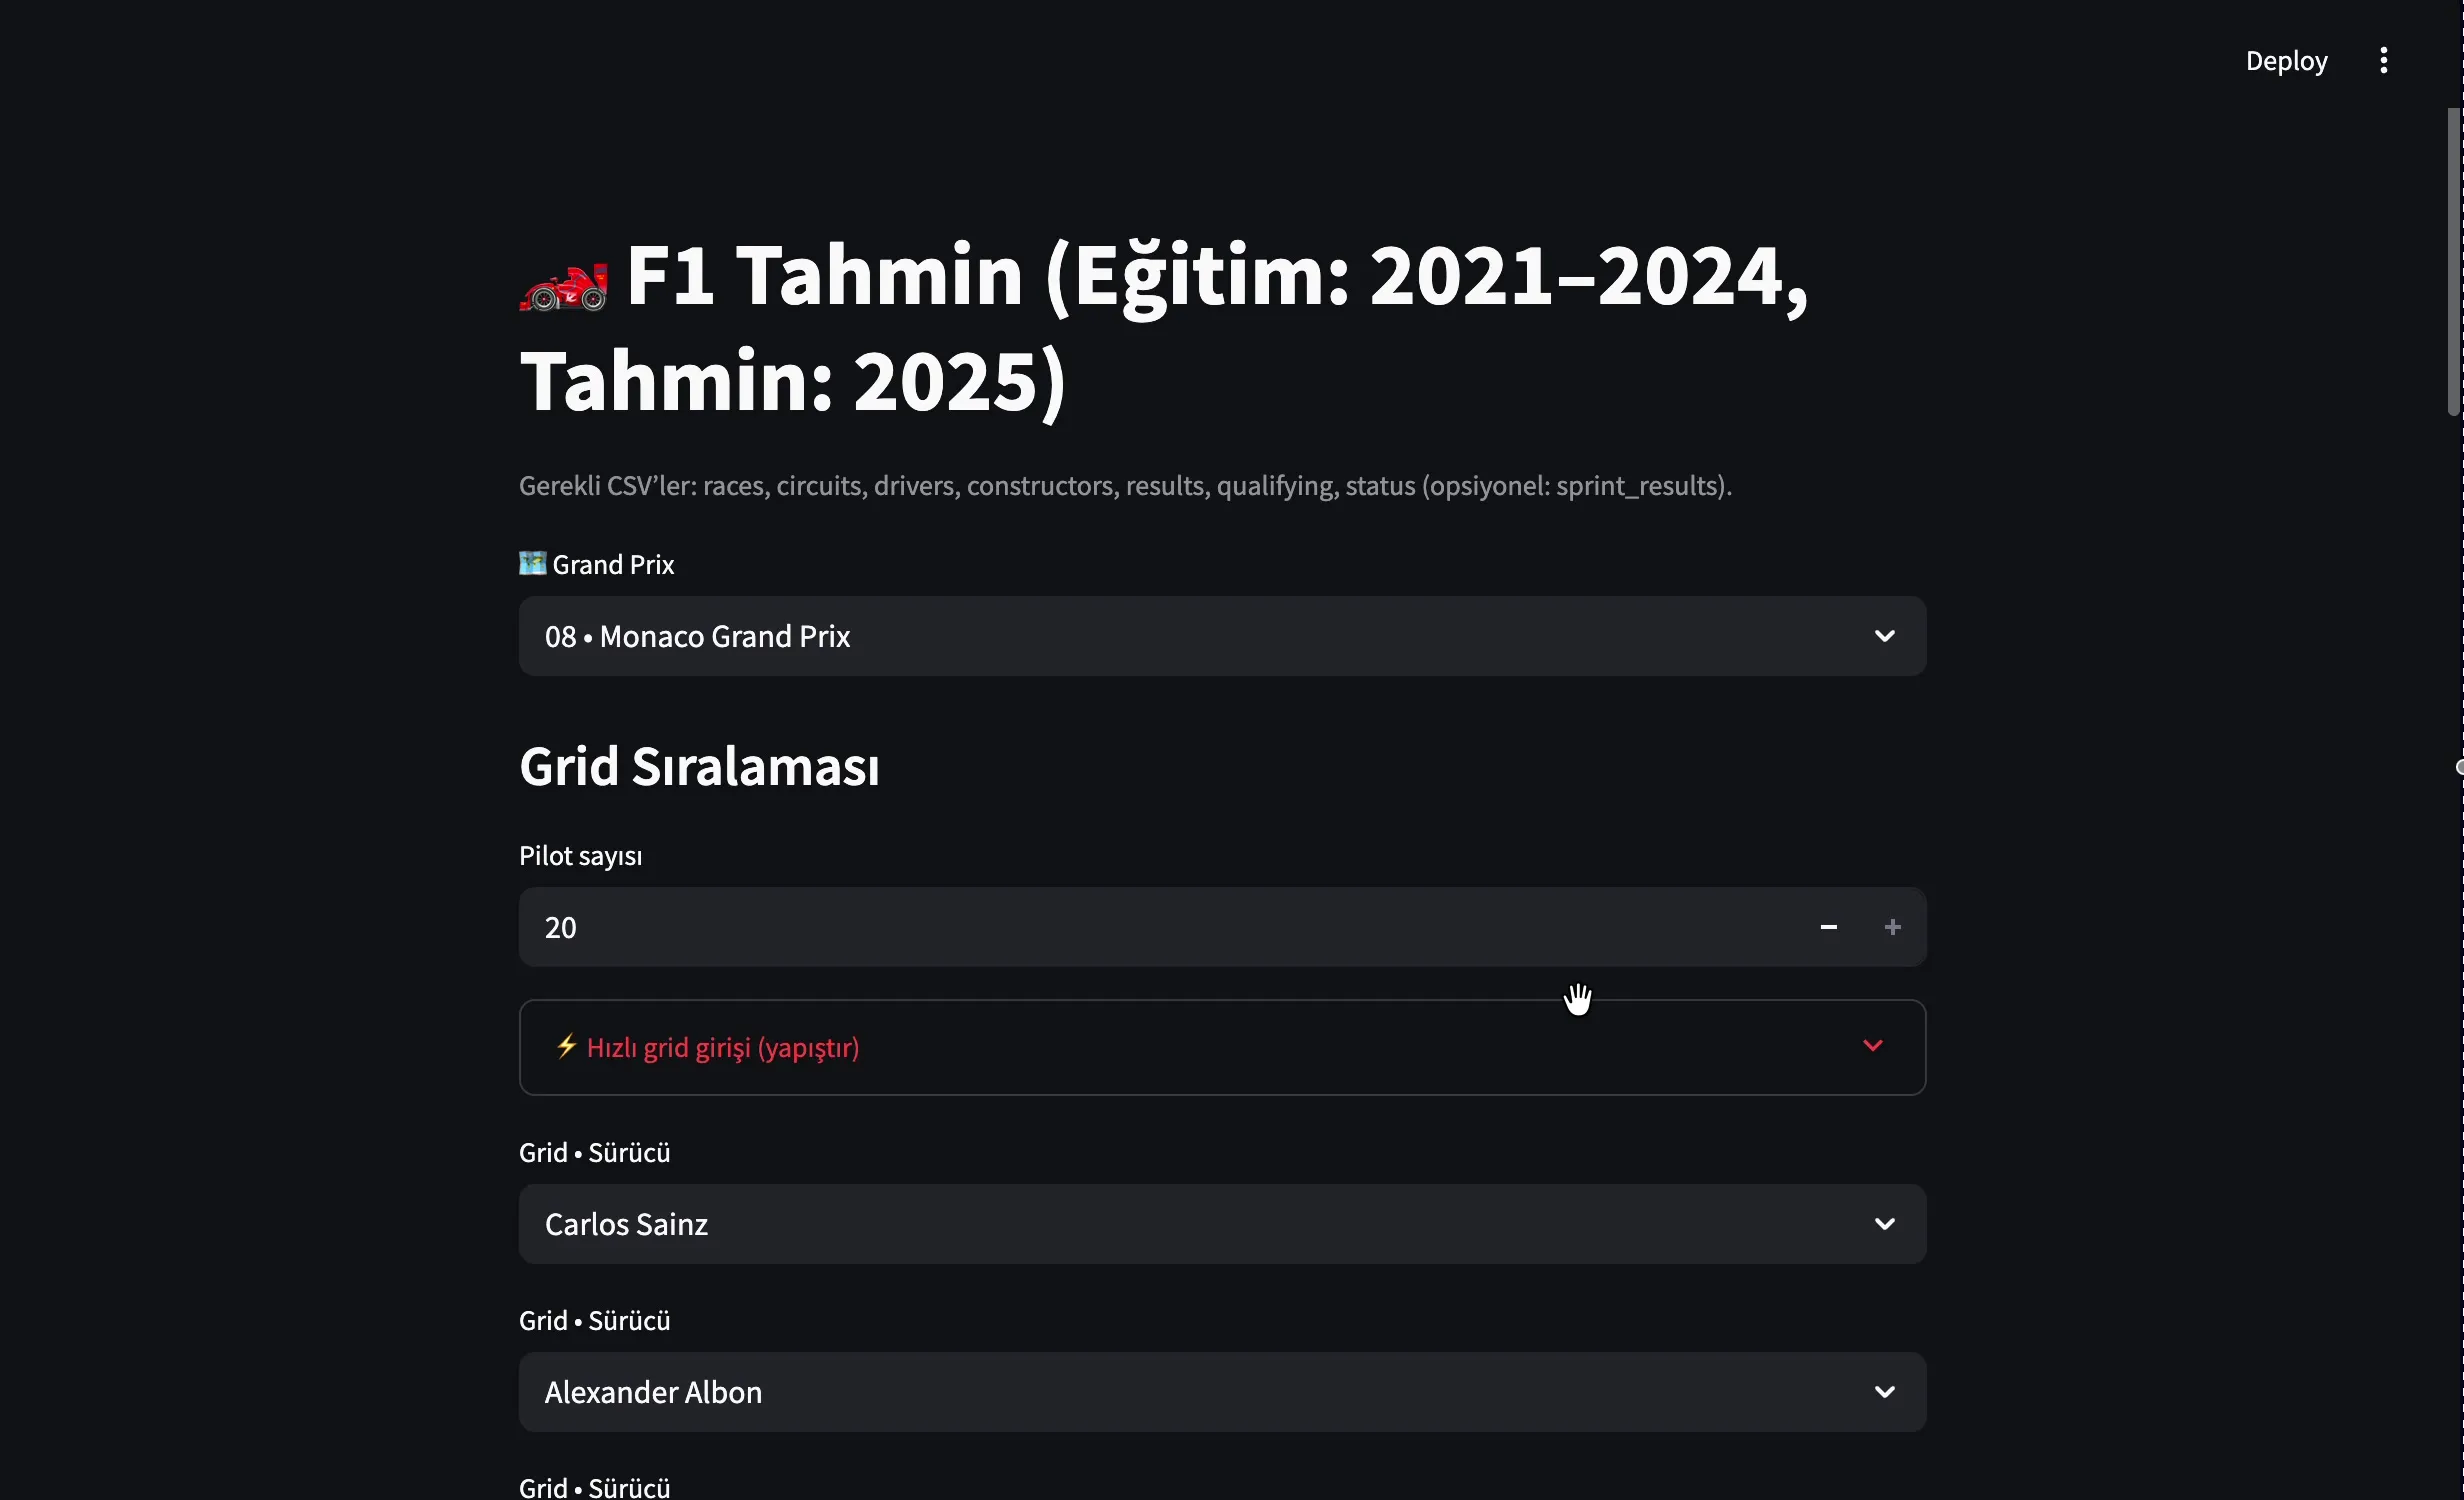
Filling twenty dropdowns by hand gets old immediately, so there is a paste box: drop in a list of names, one per line, first line is pole. It normalises Turkish characters so that names typed on a Turkish keyboard still match, and falls back to surname matching when the full name does not. It refuses to predict if the same driver appears twice, which is the kind of thing you only add after doing it to yourself.
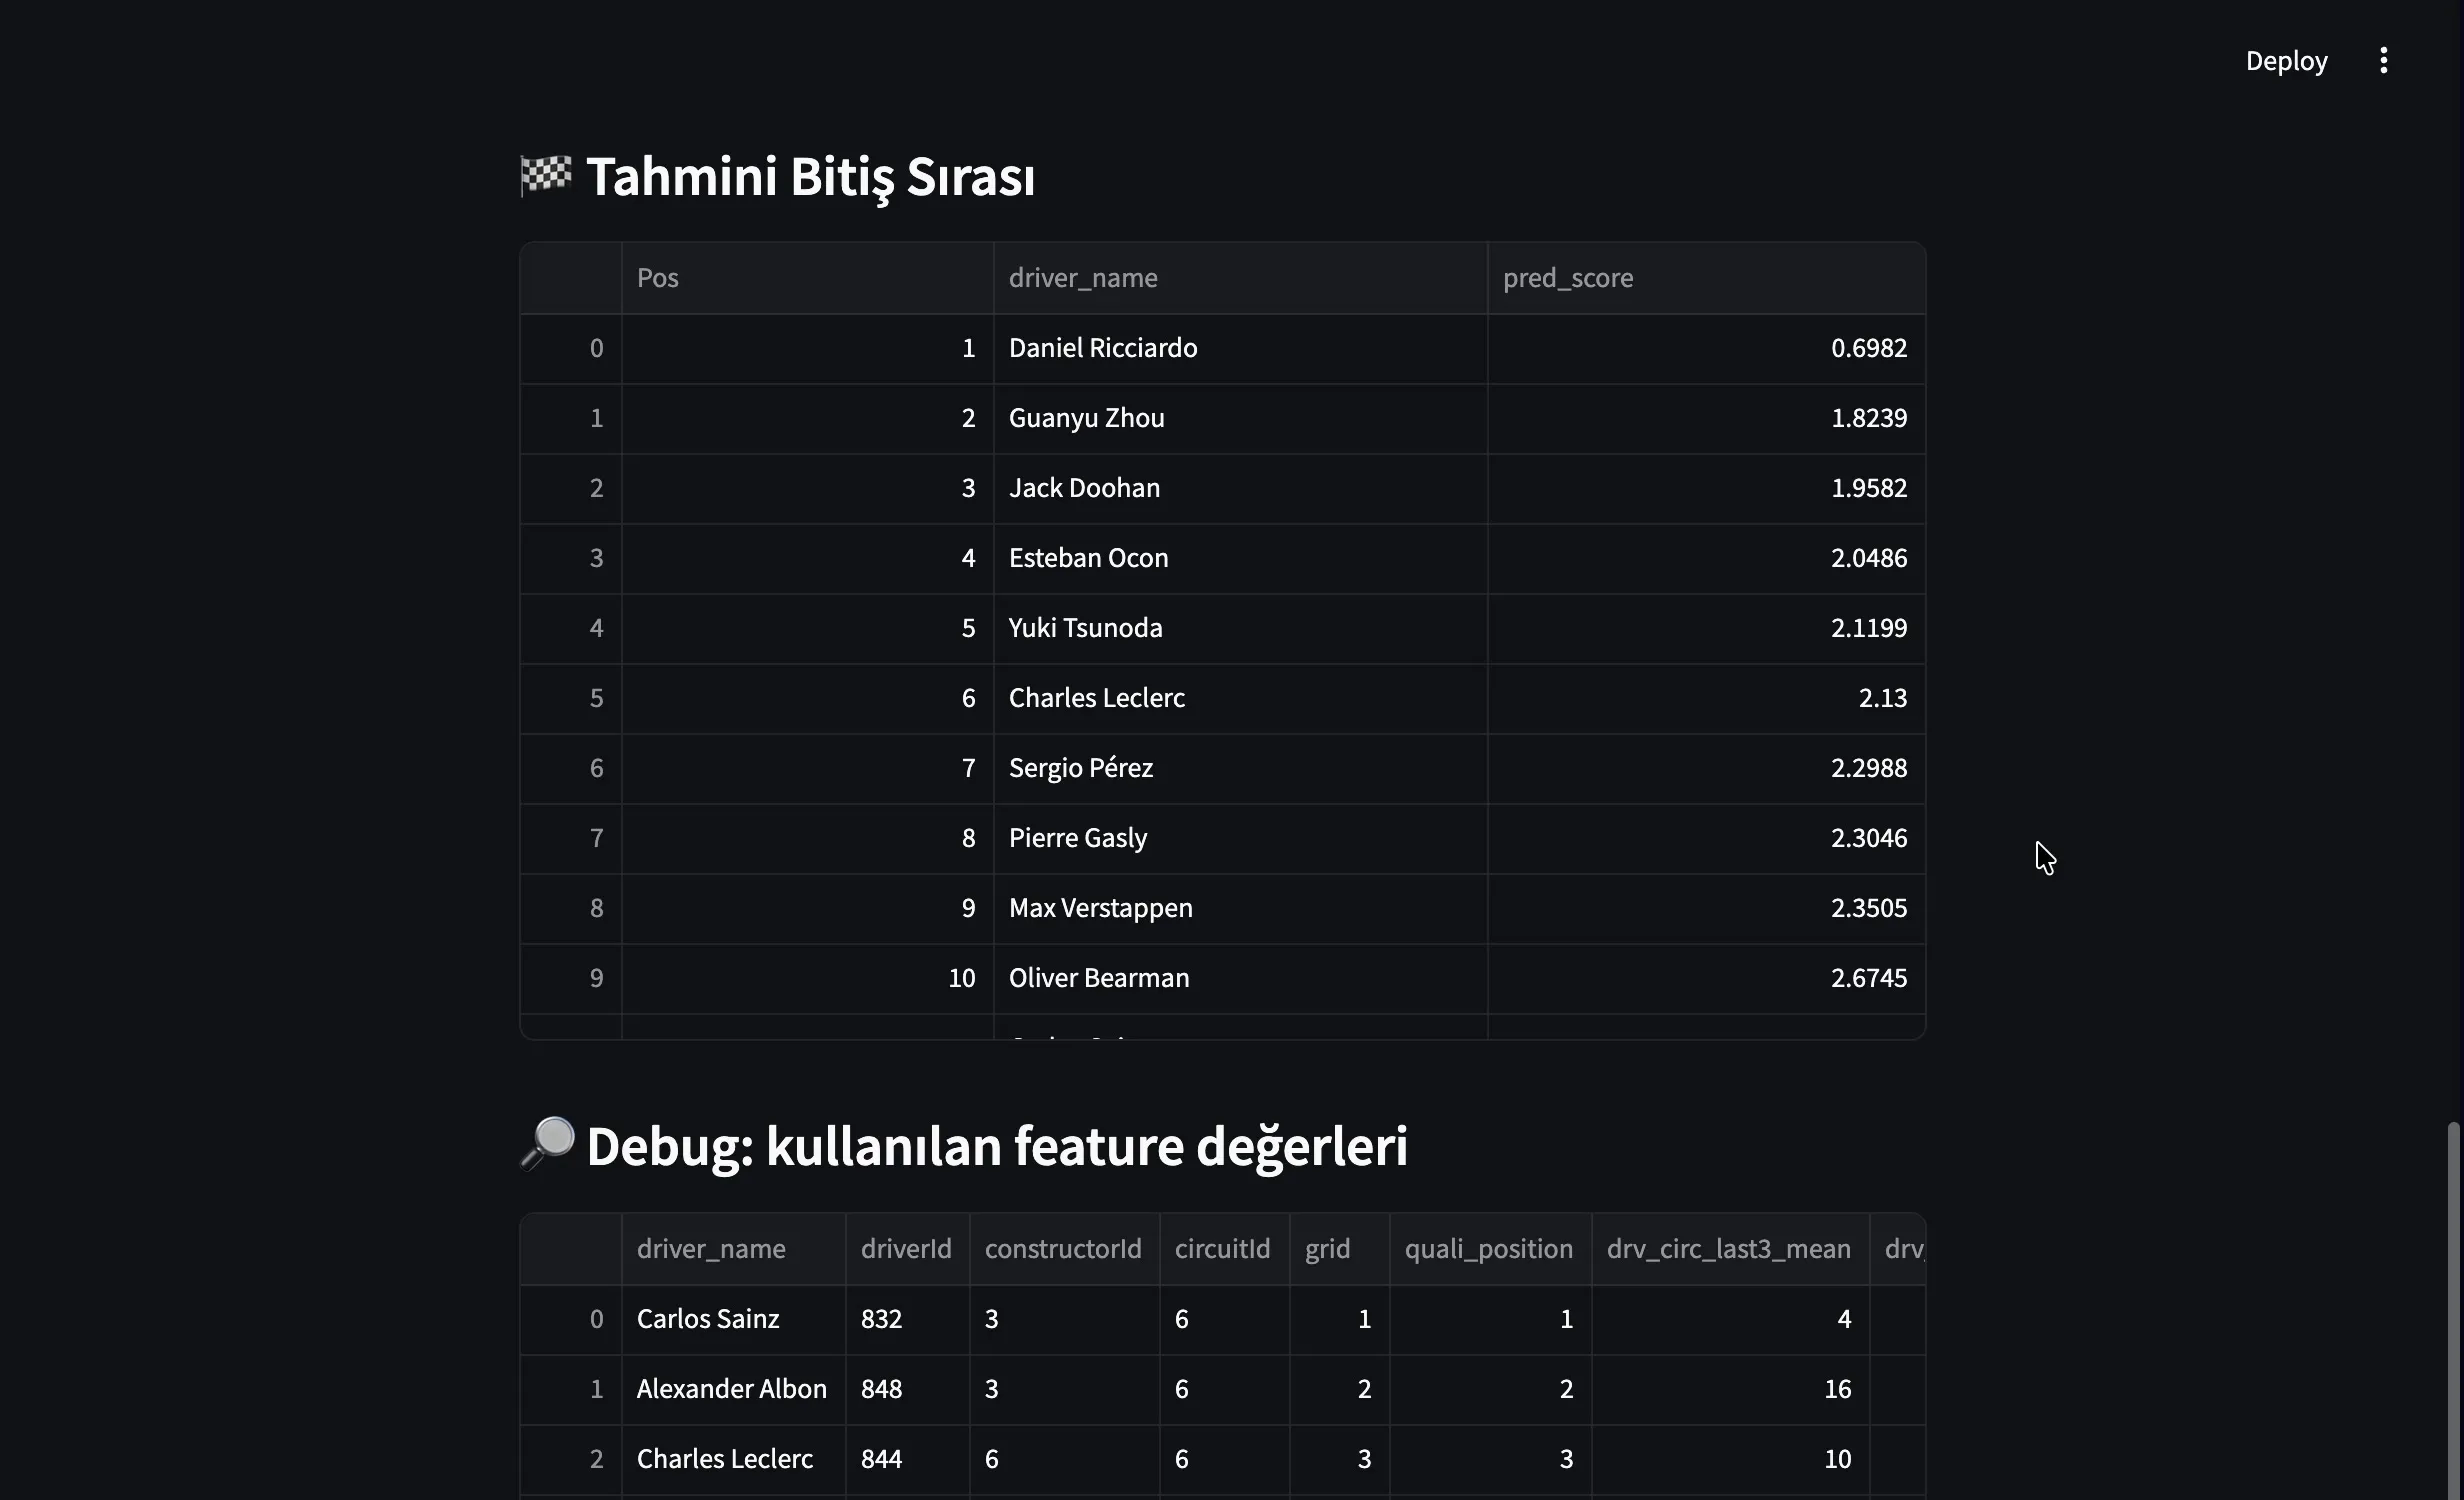
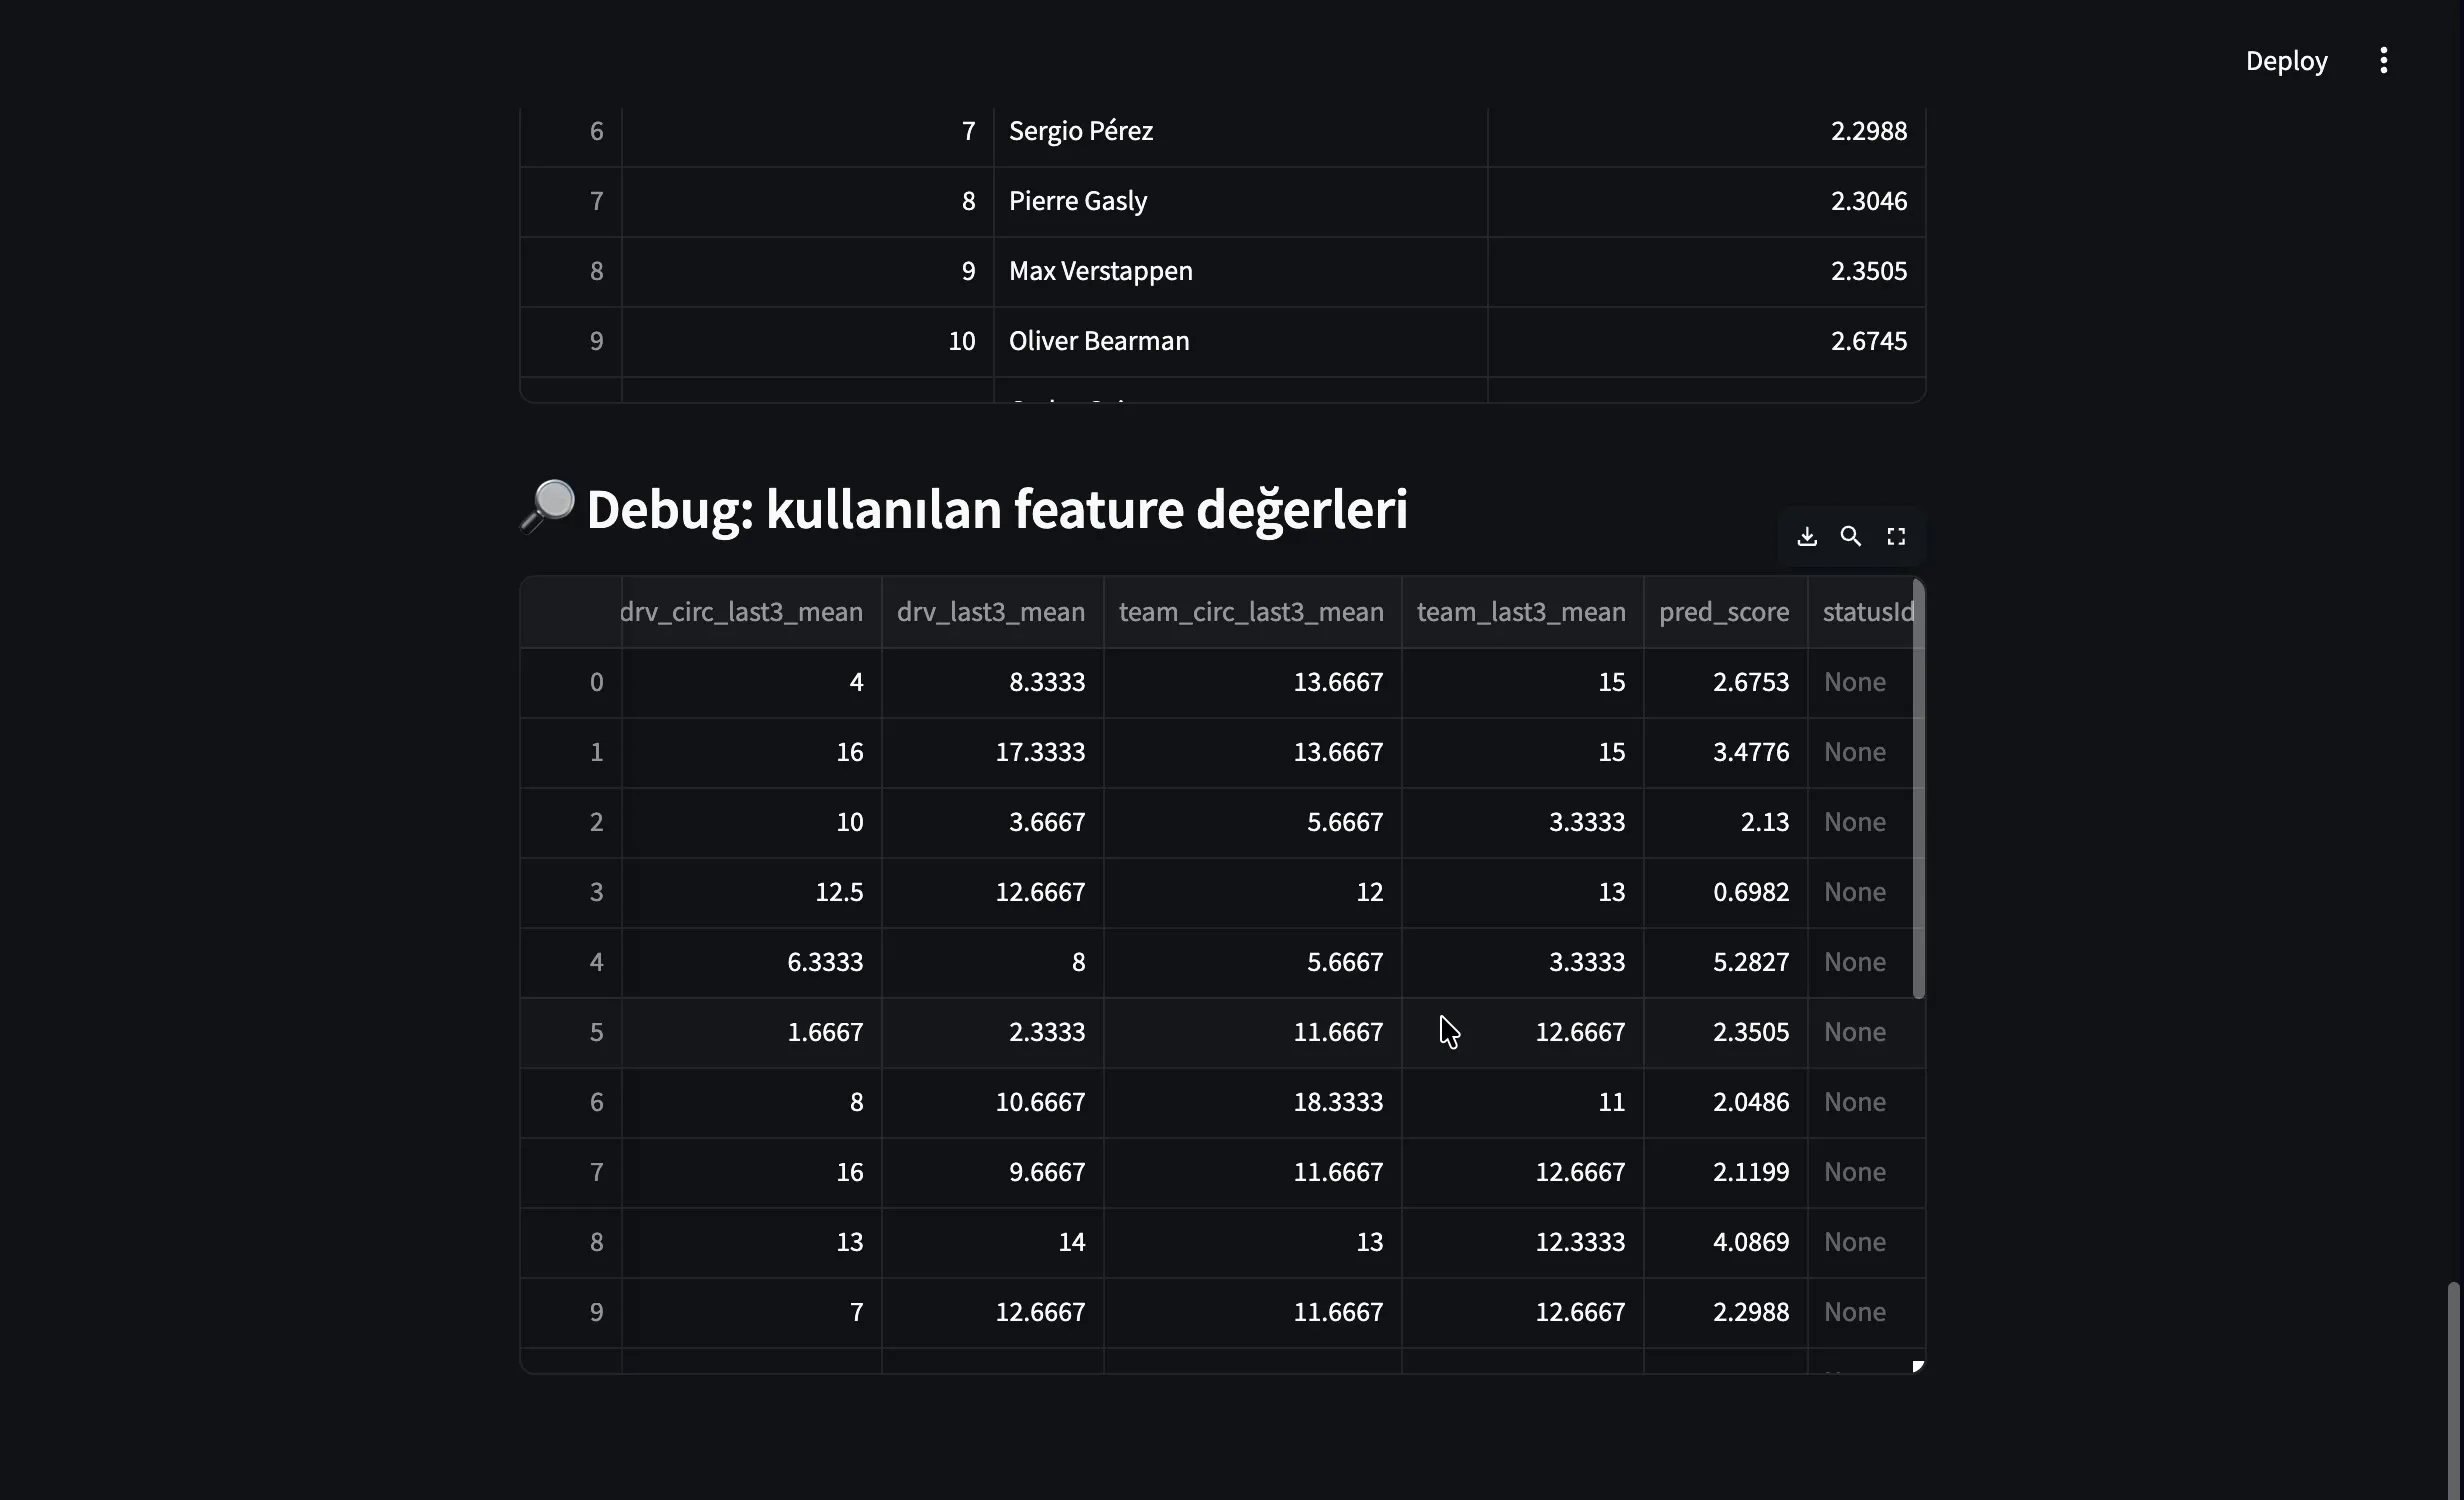
For each driver on the grid the app resolves their current team, using this season if they have raced in it and their most recent season otherwise. It recomputes the four form features against the chosen circuit, aligns the categorical levels with the ones the model was trained on, and asks for a score. Sorting by that score is the prediction.
What the finished application does
- Loads and joins the historical race, qualifying, driver, team and circuit tables
- Derives its own training and prediction seasons from the data, not from a constant
- Builds four rolling form features, each shifted so a race cannot see its own result
- Trains a LightGBM lambdarank model with rows grouped one race at a time
- Takes a starting grid by dropdown or by pasted list, with duplicate-driver validation
- Resolves each driver to a current team and recomputes their form for the chosen circuit
- Returns a predicted finishing order, and can show every feature value behind it
Where the limits are
One honest caveat about the model. The feature list still includes the race status code, which records whether a car finished, retired or crashed. That is an outcome of the race and not something knowable before it, and at prediction time it is simply left empty. The rolling form features are properly guarded and the qualifying and grid inputs are legitimately known in advance, but I would not describe the pipeline as a whole as leak-free until that column is removed and the model retrained. Beyond that, the model knows nothing about weather, tyre strategy, reliability, upgrades or mid-season driver changes. A grid and a history of finishing positions is all it sees.
Evidence on this page: Source code · Generated output